
Using VS Code for C/C++ development at EPITA
EPITA is a French CS engineering school in the suburbs of Paris. The entire cursus lasts 5 years, with C and C++ being a major part of the second and third year.
This article is a basic introduction to Visual Studio Code for use at EPITA for C/C++ development.
Some Context
Historically, the only allowed editors at EPITA are vim and Emacs, with Geany as a backup for the second year if necessary. These editors are mandatory for exams and for a good chunk of the third year. This article does not intend to flame other editors: they all have their ups and downs. Vim is lightweight and has an ergonomic editing workflow while Emacs is extremely versatile with a large ecosystem. These choices are “forced” onto students due to the nature of the work done at EPITA: work is done on machines which use Arch Linux with no user-installable packages.
The only option for alternatives is downloading your favorite editor yourself, which is not always possible. You only have 2 GB of storage via AFS, which is not always enough for installing heavyweight editors like CLion.
Life during the pandemic
But here’s the thing: with the COVID-19, all activities were done at home, so people were free to either:
- Use their own set-up, installing Linux or WSL themselves.
- The good: You can do anything you want, such as installing custom packages (or editors!)
- The bad: Linux distributions are not always easy to set up (especially if you are trying to use Arch to have the same packages), and the packages and software versions are not always the same. Because the school computers run Arch, they always have the latest versions. Additionally, there are packages which are straight up only available through the AUR, such as Criterion, and a manual installation will not always do the trick1.
- The ugly: If something breaks, you’re on your own. Support to custom systems is not provided by the school.
- Use a school-provided VM which mirrors what is on the actual school computers.
- The good: supported by the school, you get help if something breaks. You also have access to the exact versions the school requires and packages such as Criterion.
- The bad: You cannot easily install custom packages, although manually executing binaries from your home folder is possible.
- The ugly: The VM takes forever to launch if you do not have a good Internet connection. The image used is regularly updated by the school2 and each update can take hours to be downloaded (2 GB!) and installed. There is a “do not update” option at boot, but even then, you may end up with outdated packages, and regular updates are still required. Not only that. VMs are also quite heavyweight on system resources: if you do not have a fairly powerful computer, you are screwed.
The part that interests here is that: it is possible to used custom editors, even if you are on the VM.
With this, a significant diversity in editor choices has appeared.
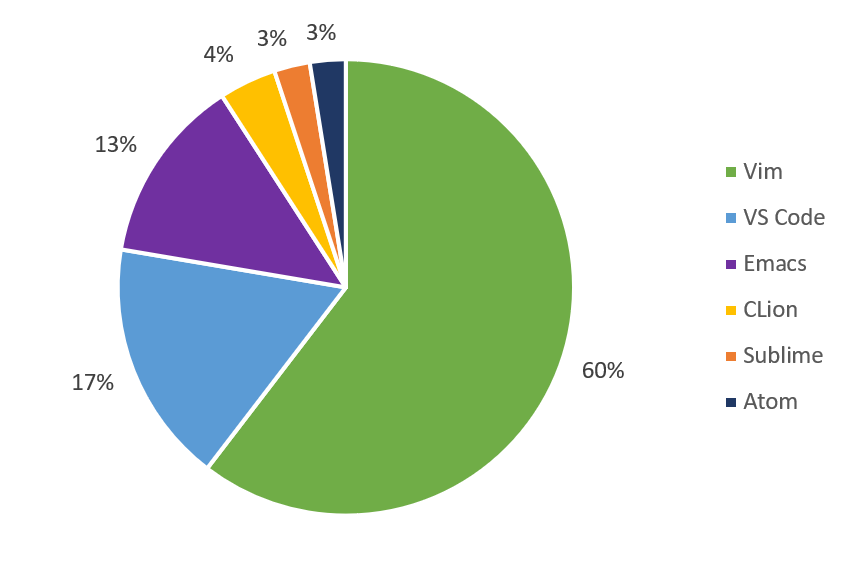
Vim is still massively popular, with just under two thirds of students using it. But the second editor is… VS Code?
Yes: although it has never been an official editor at EPITA, VS Code is the second most popular editor!
Why VS Code?
VS Code is a perfectly viable solution compared to Vim and Emacs, but some may wonder why switch to it if they’re perfectly happy with their current solution… Or heck, you may be wondering if Vim and Emacs may be for you even though you’re currently using VS Code!
-
Compared to vim…
- If you’re using Vim, VS Code provides better language support and a shallower learning curve. Should you forget how to do something, the solution is just a
Ctrl+Shift+Paway. You can still get the Vim modal system you love using the very popular Vim emulation extension. You also get fantastic debugger integration with VS Code. - If you’re using VS Code, Vim is lighter, more flexible, has a different and more ergonomic editing system and provides a more code-like approach to configuration compared to VS Code’s JSON files.
- If you’re using Vim, VS Code provides better language support and a shallower learning curve. Should you forget how to do something, the solution is just a
-
Compared to emacs…
- If you’re using Emacs, VS Code provides a shallower learning curve and makes installing language support extensions a single click away. While Emacs keymaps are available, you can also just use VS Code’s integrated shortcuts, which follow a more traditional “map”. VS Code provides better integration with WSL, as you do not need to install an X server. Debugging is also easier in VS Code compared to
gdb-many-windows - If you’re using VS Code, Emacs has a much greater extension ecosystem and better flexibility. It is also generally more customizable.
- If you’re using Emacs, VS Code provides a shallower learning curve and makes installing language support extensions a single click away. While Emacs keymaps are available, you can also just use VS Code’s integrated shortcuts, which follow a more traditional “map”. VS Code provides better integration with WSL, as you do not need to install an X server. Debugging is also easier in VS Code compared to
If you have not used any of Vim, Emacs or VS Code, VS Code is probably the easiest option of the three. While all editors have quite the learning curve, VS Code’s is by far the shallowest, as it follows more established shortcut traditions.
Please note that VS Code makes use of telemetry. If you want to learn more, including how to disable it, see here.
VS Code Navigation
Now that some context is established, let’s see how to do stuff with VS Code. This section focuses on intrinsic VS Code stuff. If you are wondering, I am using the Nord theme with the Cascadia Code font.
To get started, open the folder you want to work in. This will be our workspace
If a shortcut consists in multiple key presses, it is a called a “chord”. Simply press the multiple shortcuts, one after the other. For example, to open the “keyboard shortcuts” menu, whose shortcut is Ctrl+K Ctrl+S, first type Ctrl+K, then Ctrl+S. You can hold the Ctrl key between the two shortcuts, but you do not have to.
Basic Shortcuts
Here are basic shortcuts you need to know:
Navigation
| Shortcut | Action |
|---|---|
Ctrl+N |
creates a new file |
Ctrl+Shift+N |
creates a new window |
Ctrl+C and Ctrl+X |
are used to respectively copy or cut the selected text. If no text is selected, they will respectively copy or cut the current line. |
Ctrl+V |
to paste |
Ctrl+J |
toggles the (bottom) panel |
Ctrl+B |
toggles the side bar |
Searching
Ctrl+P and friends.
| Shortcut | Action |
|---|---|
Ctrl+P |
opens a “universal search bar”. By default, it allows you to search for a file. Type ? to see what you can do with it. |
Ctrl+Shift+P |
is used to search among available commands. This is extremely useful as it will also show you the shortcuts for each command. Equivalent to Ctrl+P then typing >. |
Ctrl+T |
is used to search for symbols (functions, classes…), equivalent to #. |
Search and replace
| Shortcut | Action |
|---|---|
Ctrl+F |
to search in the current file |
Ctrl+Shift+F |
to search in all files |
Ctrl+H |
to search and replace in the current file |
Editor Layout
One of the more important feature is how you can lay out your editors.
VS Code uses the notion of “editor groups” (or “editor regions”), each of them containing tabs. By default, you only have one editor group at the center of your editor, which contains a bunch of tabs.
Creating editor groups
The easiest way of creating editor groups is to just drag and drop your editors to the location you want.
You can also create new editors using the following shortcuts:
| Shortcut | AZERTY | Description |
|---|---|---|
Ctrl+\ |
Ctrl+* |
Splits the editor vertically (new editor to the right) |
Ctrl+K Ctrl+\ |
Ctrl+K Ctrl+* |
Splits the editor horizontally (new editor below) |
Moving around
Moving around (both in tabs and across editor groups) can be done with the following shortcuts:
| Shortcut | Description |
|---|---|
Ctrl+Tab |
(repeated) Change between tabs in the current editor group, ordered by the most recently used. |
Ctrl+K Ctrl+Arrow |
Change focus between editor groups. Arrow can be right, left, up or down to move to the left, right, upper or lower editor group. |
Ctrl+K Arrow |
Move the current editor group. Arrow can be right, left, up, down to move to the left, right, upper, lower editor group. This moves the editor group, it does not merge groups. |
There are many more shortcuts, which may be a bit weird to type on a keyboard. Feel free to check out VS Code’s documentation on editor groups.
Git Integration
VS Code provides integrations with many tools and languages, usually giving you a better developer experience.
VS Code provides a simple Git integration that allows you to stage, commit, push, pull and more. All of this functionality is provided in the Source Control panel in the side bar.
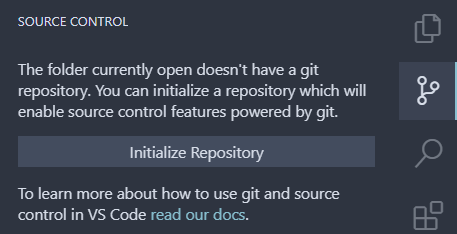
If you did not clone your repository and you need to initialize it. Click on the “Initialize Repository” button and you should be good to go.
Commits
The main use of the Git side bar panel is for staging and committing stuff.
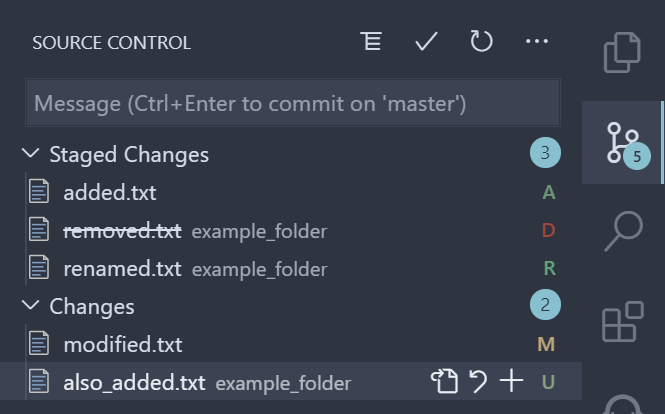
The “Staged Changes” section shows you which files are going to be committed. The “Changes” sections shows changes that will not be added to the commit. A letter next to each changed file indicates what kind of changed this is:
Dfor deleted filesRfor renamed filesUfor untracked (i.e. files Git does not know about)Afor added filesMfor modified files
Hovering on each file gives you a few options. In the screenshot, the options for “also_added.txt” are, in order:
- Go to file
- Revert change
- Stage (move the file to the staged changes)
For staged changes, the last option is the option to unstage the file (moving it back to the “Changes” section).
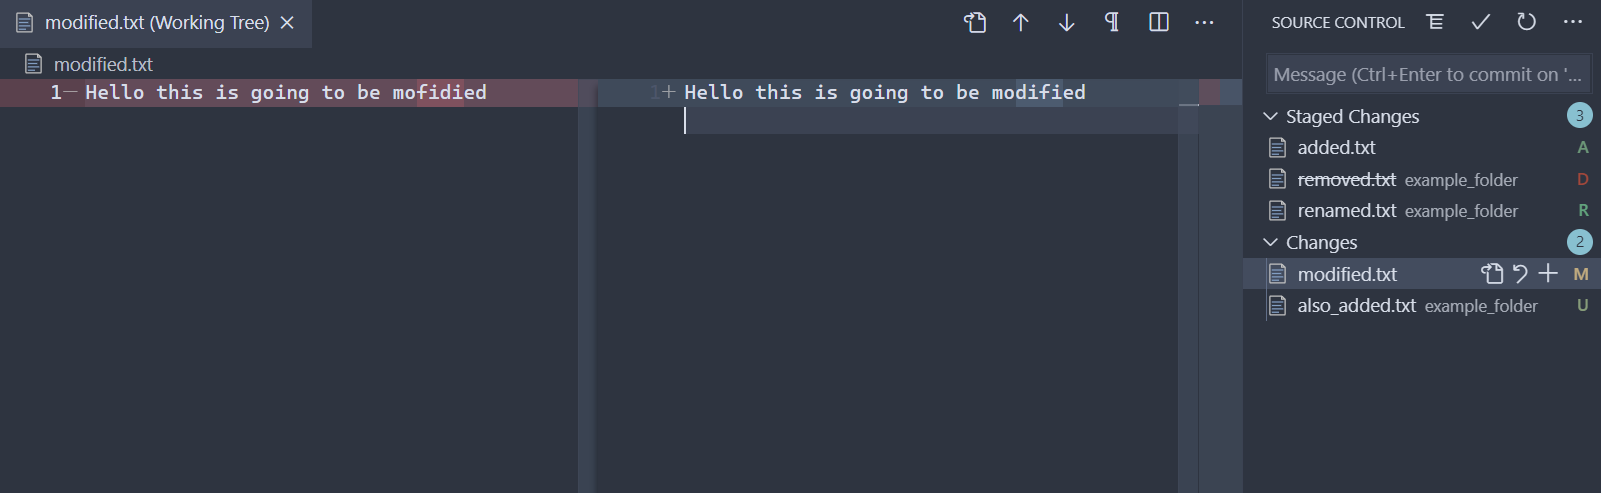
Clicking on a file will show you an overview of what happened.
In order to commit your changes, type a message in the “Message” box and press Ctrl+Enter to commit or click on the tick icon.
Branches and checkout
The status bar provides information on the current branch and remote state.
Here is an example:
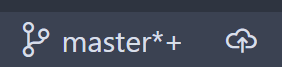
On “master” branch, has unstaged changes *, has staged changes +, not published on remote (arrow pointing at cloud).
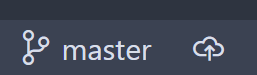
On “master” branch, no changes, not published on remote.
Clicking on the arrow-pointing-at-cloud button will publish your branch to the remote repository. That button will then become an indicator of how many commits are present locally but are not on the remote (they need to be pushed, hence the up arrow), and vice versa (they need to be pulled, hence the down arrow).

In this specific instance, no commit needs to be pulled and 1 commit needs to be pushed.
Click on the double arrow button to “synchronize” your branch, which will automatically pull to and push from it.
You can click on the branch name to switch to a new branch.
Getting more
There are many more options available. If you want to extend what VS Code can do Git-wise, check out (hehe) the GitLens extension, which has things like blame, rebasing, etc.
C/C++
Time to go right into the hot topic: C/C++ in VS Code.
Most of the functionality is available right out of the box: simply install the “C/C++” extension by Microsoft.
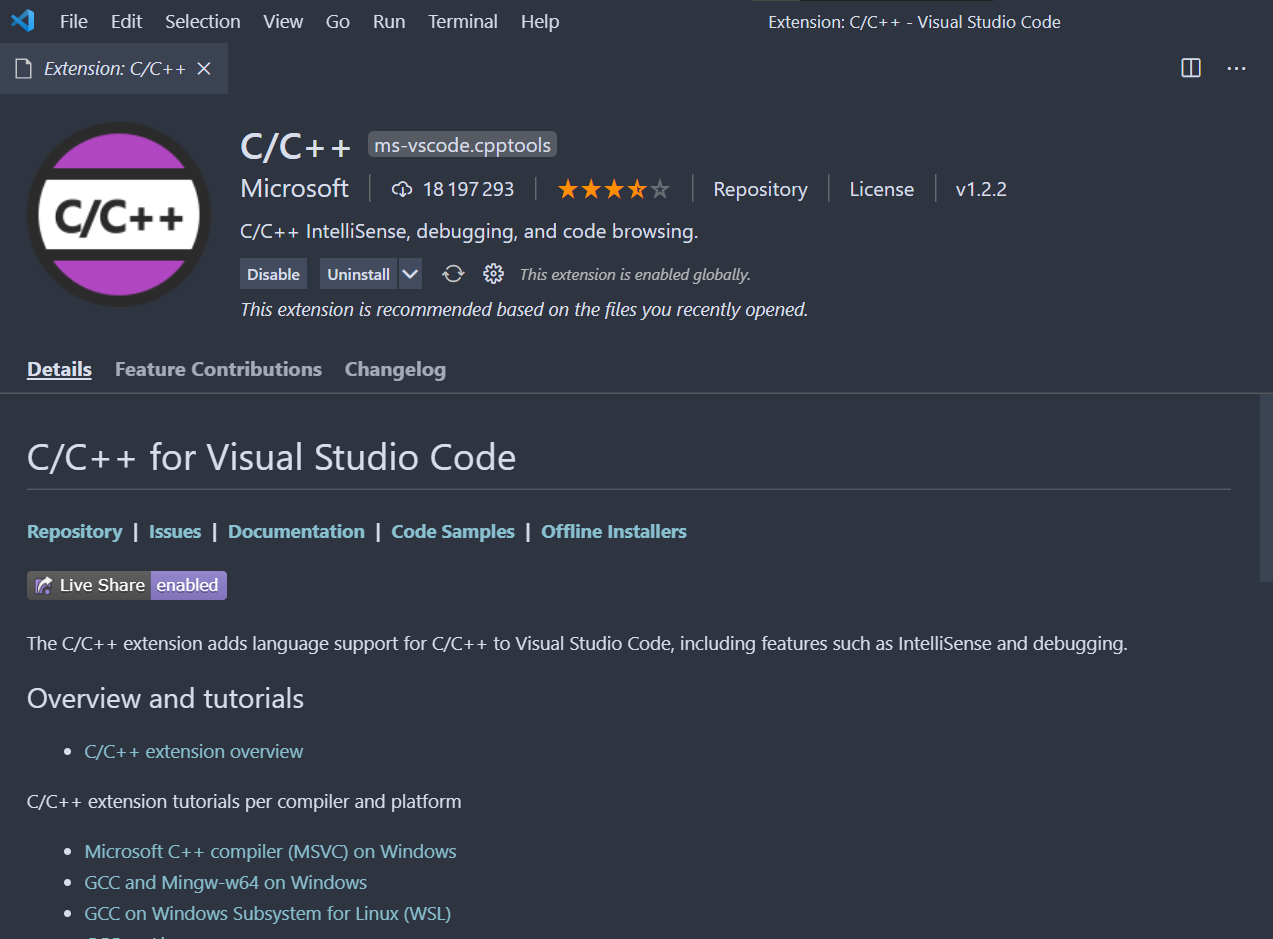
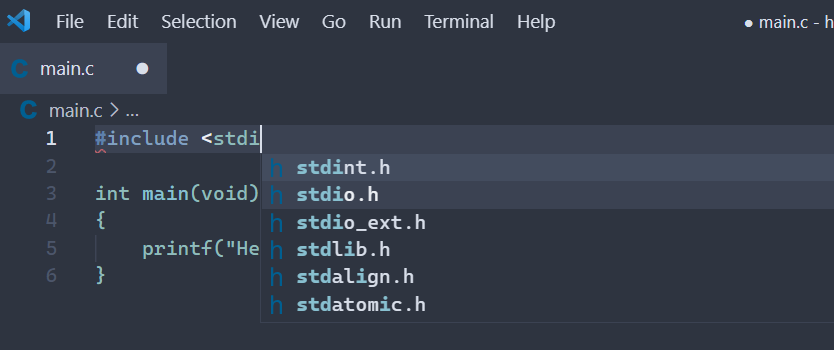
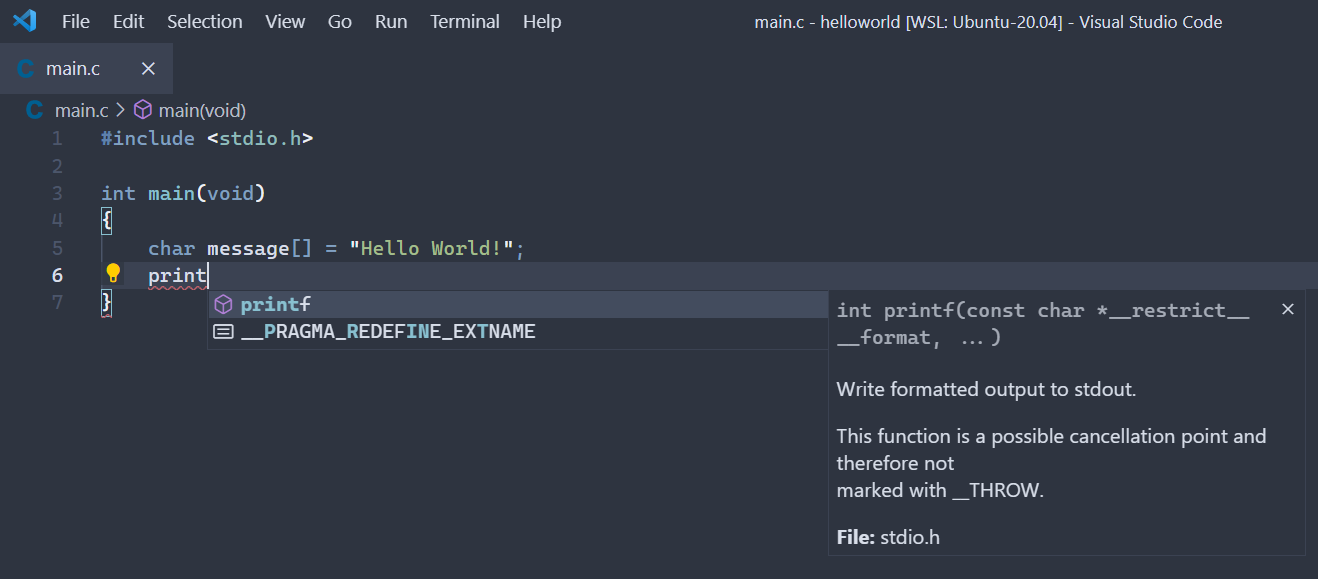
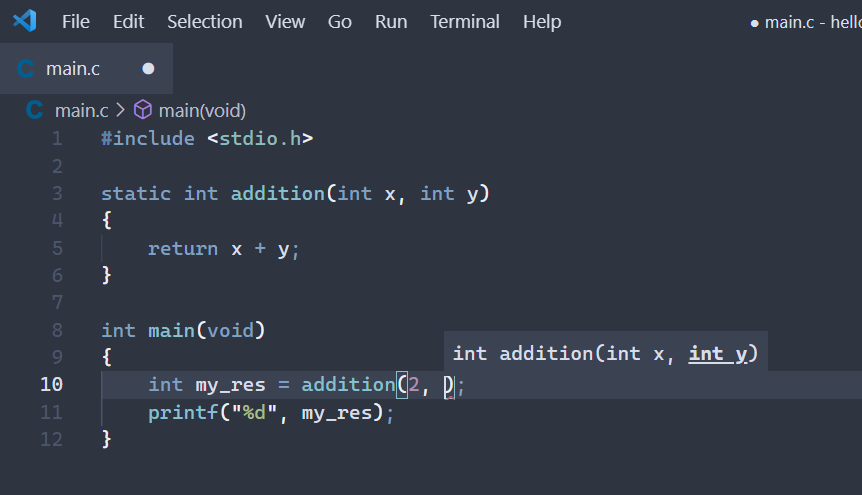
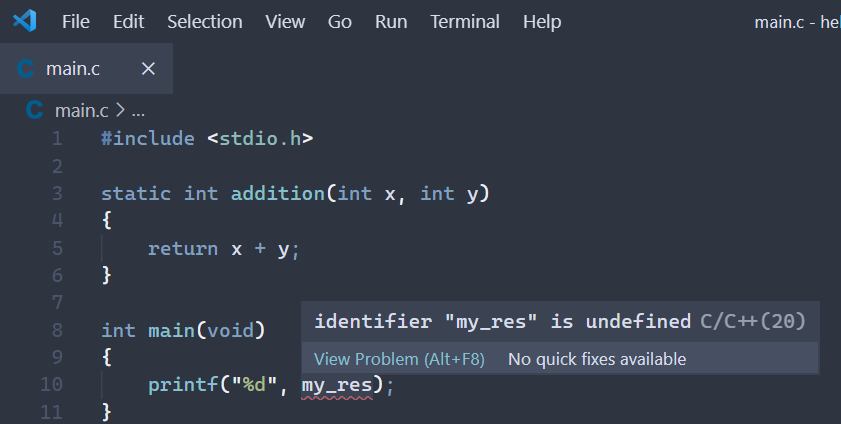
Here are examples of things that you can do in C with 0 configuration:
Configuration
The C/C++ extension does not pick up your command line flags by itself, and you need to do some extra configuration to let it know about the standard version and other compilation details.
Configuring the extension (with CMake)
If you have a CMake project, just install the CMake Tools extension (also by Microsoft), and you’re good to go!
Configuring the extension (with a Makefile)
This includes projects that use autotools/automake and anything that uses a Makefile to build things. You will need the “Makefile Tools” extension by Microsoft. If you are using CMake, just use the CMake extension.
If you are using autotools, automake, or any other tool that first needs to call some commands to generate relevant tools, you can either call these commands before launching VS Code, or:
- If you need to launch multiple commands, create a script that launches all required commands
- Go to the settings
- Search
makefile.preConfigureScript - Click on “Workspace” to set this setting for this project only
- In “Pre Configure Script”, put the command that needs to be launched.
The multiple commands script could look like this for the Spider project:
#!/bin/sh

set -e # Fail on first error

./autogen.sh
./configure
When prompted on if you want to use Makefile Tools for the folder, answer “Allow”. If you forgot, or did not see the message, launch the command palette and run C/C++: Change Configuration Provider..., then select Makefile Tools.
You can then set the compile and run targets in the “Makefile” panel in the side bar.
If you have a lot of targets, you can configure the extension to only display .PHONY targets via the makefile.phonyOnlyTargets config.
Configuring the extension (manually)
Only use this as a last resort. Extensions will probably do a better job of configuring the C/C++ extension than you can.
You will need to configure the C/C++ extension: this is done using the .vscode/c_cpp_properties.json file.
Launch the command palette using Ctrl+Shift+P then search C/C++: Edit Configuration. The JSON file is easy to edit if you want to go the manual route, but the UI provides more helpful information.
- Make sure you are on the “Linux” configuration
- Compiler path should point to the latest version of GCC or Clang
- Compiler arguments should be the arguments passed to the compiler. For ING1, this is (
-Ddefines and the standard version are configured elsewhere). - Set IntelliSense Mode to the correct mode, which should be either
linux-clang-x64orlinux-gcc-x64depending on what you’re using. - Set your Include Path, one location per line. This is where the C/C++ extension will look for system
.hfile (e.g. where it will look for<thing.h>files). If you are using non-standard headers, you may need to tweak this value. - If you use defines (
-D), set them in the Defines section - Set the C standard version
Alternatively, you can point to a compile_commands.json file, if your build system is able to generate one for you.
Where are my warnings?
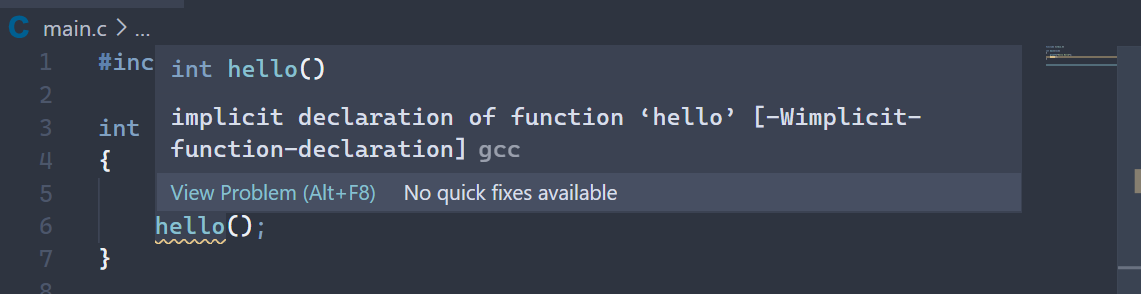
C/C++ does not report warnings on its own and will unfortunately not show all warnings (see this issue) despite correct settings. However, VS Code will show warnings on compilation as long as you compile using Tasks – compiling in the terminal will not make VS Code pick up the errors.
This code, although invalid (hello() has never been declared), will not generate any warning or error:
#include <stdio.h>

int main(void)
{
    printf("Hello World");
    hello();
}
However, building using a task will allow VS Code to parse GCC’s output, resulting in:
Autocompletion
VS Code will give you autocompletion options when writing code. You can use the following shortcuts:
| Shortcut | Description |
|---|---|
Ctrl+Space |
Triggers the suggestion panels at your cursor |
| Up/Down arrows | Navigate through the suggestions |
Enter |
Apply the selected suggestion |
VS Code automatically determines whether . or -> should be used when applying suggestions.
Code Formatting
The C/C++ extension provides a formatter using clang-format, which will pick up any .clang-format file you have. You can format your code directly from VS Code, using the Format document command (Alt+Shift+F by default).
You can also enable the “Format on X” options to automatically format your files upon saving them, editing them, etc.
Tasks
Tasks are shortcuts for interacting with external tools within VS Code. They are the replacement for running commands manually in your terminal for tools that aren’t directly integrated in VS Code, or that are not flexible enough for you.
You can use them for many things, such as compilation or running tests. If you want to run your project, use the debugger instead, which can also launch tasks before launching your programs. Tasks also have a notion of dependencies, i.e. your test task can depend on your compilation task, meaning VS Code will first run the compilation task, then the test one.
Tasks can also parse the output of the commands using matchers, which will then represent the errors within the editor. This is especially useful for compilation, since the linter does not properly highlight everything.
Tasks for C/C++
While tasks have a lot of built-in integrations and auto-detection features for the JS ecosystem, VS Code supports custom tasks that run regular shell commands.
First, if you do not have a tasks.json yet, launch the command palette with Ctrl+Shift+P, then choose “Tasks: Configure Task”, “Create tasks.json from template” then “Others”.
For simple tasks that just run a command, you can use something like this:
{
  "label": "Compile",
  "type": "shell",
  "command": "make all"
}
This is the simplest kind of task, but will not get us far by itself. How do we run that?
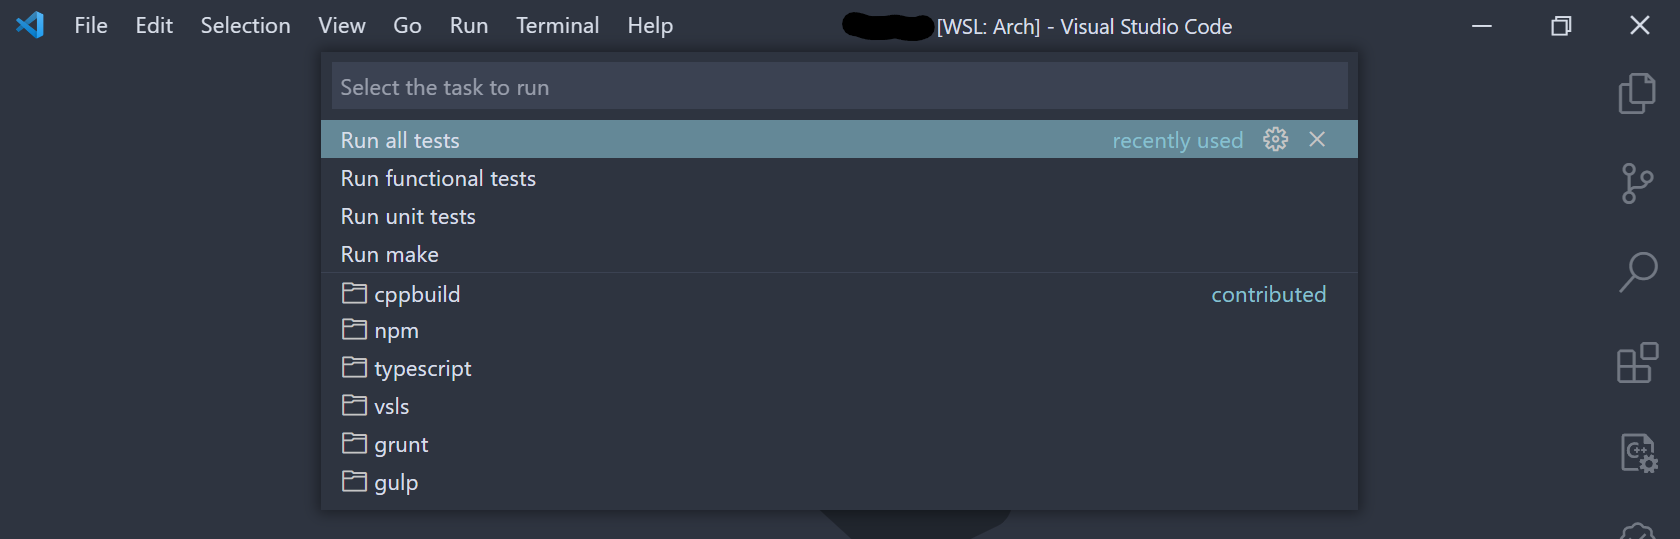
Running Tasks
By default, VS Code only provides a shortcut for the default build task, which is lame.
You can run tasks using various commands. Use Ctrl+Shift+P then “Tasks” to see what is available. I’d personally recommand adding Ctrl+K B as the Tasks: Run Task command, which opens a task selection panel, and Ctrl+K Ctrl+B as the Tasks: Rerun Last Task, which runs the last task you launched.
Problem Matchers
Problem matchers parse the output of your tasks and display problems in the editor. This is especially useful for compilation tasks: any warning or error will be displayed in the file at the location where they happened.
For C/C++ development, the GCC problem matcher is what you need. Add "problemMatcher": "$gcc" to your task. In our example, this would give us:
{
  "label": "Compile",
  "type": "shell",
  "command": "make all",
  "problemMatcher": "$gcc"
}
Many more matchers are available, and you can also create your own custom matcher.
Task Dependencies
Tasks can depend on one another. For example, let’s say you have a test task and a compilation task in your VS Code tasks. Could VS Code automatically compile our code via our compile task before launching our test task? Turns out that VS Code does that have that feature!
Here is an example:
{
    "version": "2.0.0",
    "tasks": [
        {
            "label": "Compile",
            "type": "shell",
            "command": "make",
            "problemMatcher": "$gcc"
        },
        {
            "label": "Run testsuite",
            "type": "shell",
            "command": "./testsuite",
            "dependsOn": ["Compile"]
        }
    ]
}
You need to use the tasks’ label in the dependsOn field.
You can have multiple dependencies for a task using the dependsOn array. Do note that, by default, dependencies are ran in parallel. See the documentation for more information.
Debugger
VS Code provides a fairly comprehensive debugger interface. VS Code itself is not a debugger, as it instead provides an interface over an existing debugger program, such as GDB.
Using VS Code’s debugger is much easier than manually using GDB, although you can still run GDB commands while using VS Code, should you need a special feature that is not supported by the interface.
C/C++ Debugger Configuration
Similar to tasks, the debugger uses a JSON file to know how to launch your project.
VS Code can generate a basic one for you. Go to the Run and Debug tab in the sidebar (with the arrow and little bug), choose “Run and Debug”, then “C/C++ (GDB/LLDB)”, then “Default Configuration”.
Here is the file that this generates:
{
    // Use IntelliSense to learn about possible attributes.
    // Hover to view descriptions of existing attributes.
    // For more information, visit: https://go.microsoft.com/fwlink/?linkid=830387
    "version": "0.2.0",
    "configurations": [
        {
            "name": "(gdb) Launch",
            "type": "cppdbg",
            "request": "launch",
            "program": "enter program name, for example ${workspaceFolder}/a.out",
            "args": [],
            "stopAtEntry": false,
            "cwd": "${workspaceFolder}",
            "environment": [],
            "externalConsole": false,
            "MIMode": "gdb",
            "setupCommands": [
                {
                    "description": "Enable pretty-printing for gdb",
                    "text": "-enable-pretty-printing",
                    "ignoreFailures": true
                }
            ]
        }
    ]
}
You will need to modify the program entry to point to the executable you want to debug. ${workspaceFolder} is a variable that is the path to your workspace (i.e. the folder that is currently opened).
Pre-Launch Dependencies
If you use tasks, you can specify that your launch configuration needs to have some task ran before it can be used. This is done by passing the task’s label in the preLaunchTask field.
Here is an example:
{
    "version": "0.2.0",
    "configurations": [
        {
            "name": "Build and debug my project",
            "type": "cppdbg",
            "request": "launch",
            "program": "${workspaceRoot}",
            "args": [],
            "stopAtEntry": false,
            "cwd": "${workspaceFolder}",
            "MIMode": "gdb",
            "setupCommands": [
                {
                    "description": "Enable pretty-printing for gdb",
                    "text": "-enable-pretty-printing",
                    "ignoreFailures": true
                }
            ],
            "preLaunchTask": "Run make"
        }
    ]
}
This will run the Run make task before launching the program.
Setup commands
The setupCommands array can be used to pass custom instructions to GDB, which is especially handy for breaking on special cases such as C++ exceptions. The text field corresponds to the actual instruction. If ignoreFailures is set to false, the launch will fail if the instruction was not successfully handed to the underlying debugger.
In the following example, we pass an instruction to GDB telling it to break whenever an std::length_error is encountered in our C++ program:
{
    "version": "0.2.0",
    "configurations": [
        {
            "name": "Debug my project",
            "type": "cppdbg",
            "request": "launch",
            "program": "${workspaceRoot}",
            "args": [],
            "stopAtEntry": false,
            "cwd": "${workspaceFolder}",
            "MIMode": "gdb",
            "setupCommands": [
                {
                    "description": "Enable pretty-printing for gdb",
                    "text": "-enable-pretty-printing",
                    "ignoreFailures": true
                },
                {
                    "description": "Enable break",
                    "text": "catch throw std::length_error",
                    "ignoreFailures": false
                }
            ]
        }
    ]
}
Breakpoints
To places a breakpoint, click in the gutter on the line of code where you want the debugger to stop. A red dot will appear.
Right-clicking on a breakpoint will give you additional options for disabling it or making a conditional breakpoint. Conditional breakpoints are breakpoints that only pause the program when a given condition is true.
A recap of all the place breakpoints is available in the Run and Debug tab in the sidebar. Additionally, you can add “function breakpoints”, which will pause the program when a specific function is hit. You can also tick and untick the tick-boxes to enable/disable breakpoints. Additional options are also available.
Debugging
Launch your program using the “Run and Debug” tab in the side bar (arrow and little bug icon). Then, select the configuration you want to launch and click on the arrow to launch the debugger.
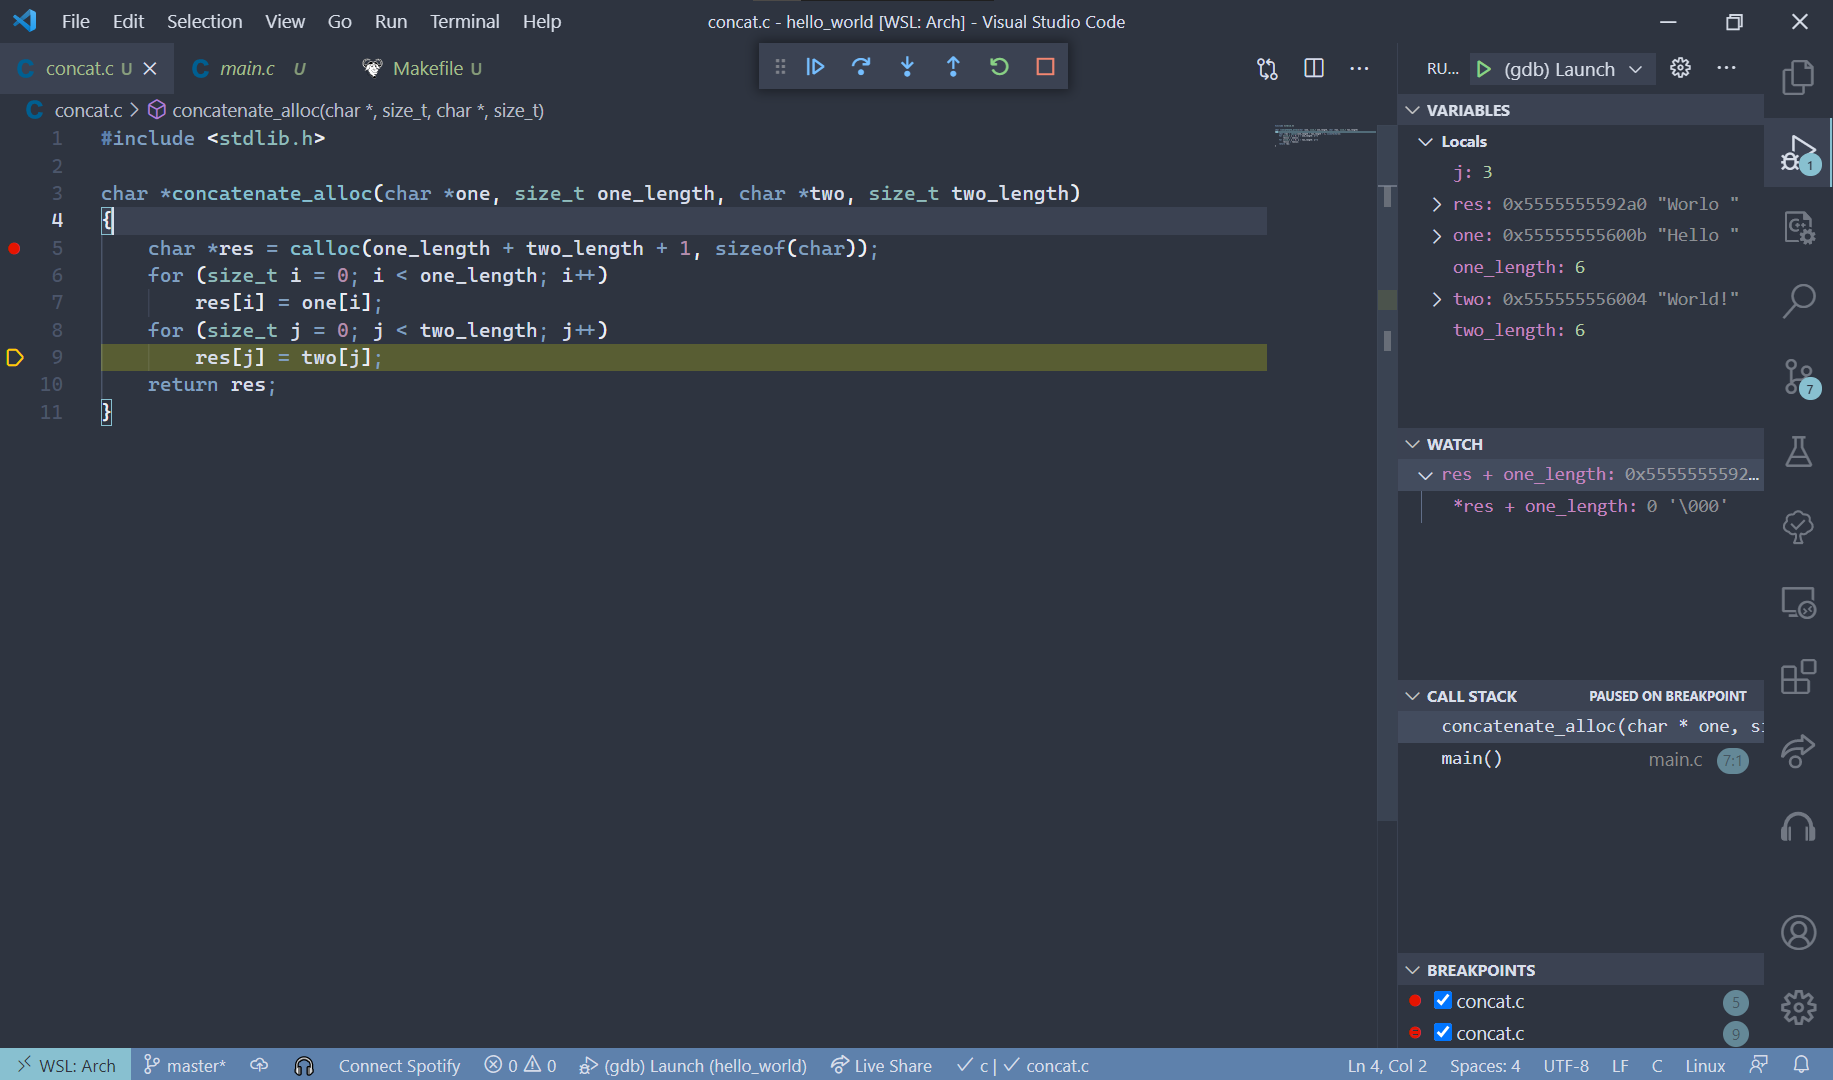
While debugging, the status bar will be in a different color, depending on your theme. Additional buttons will be available to let you control the flow of your application.
Six debugging commands are available (in this picture at the top, just below the window border):
- Resume/pause execution
- Step over (go to next line)
- Step into (go into the body of the called function on this line)
- Step out (get out of the current body of the function)
- Re-run program (stops and relaunches the program)
- Stop execution (exits the program)
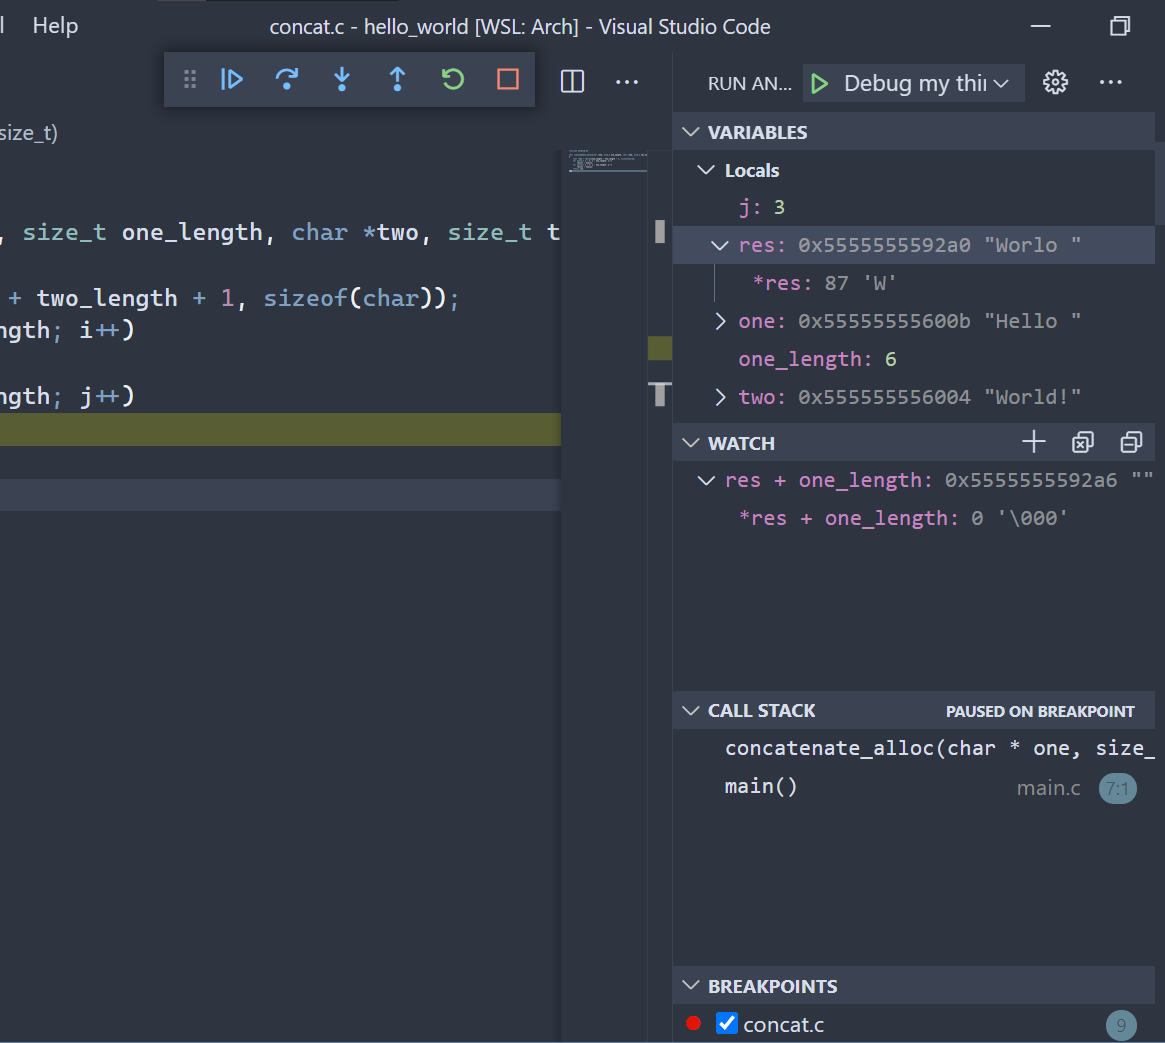
Additionally, the run and debug side bar panel changes and includes:
- Variables/locals: the values of whatever is currently on the screen, such as variables, parameters, etc. Pointers, structs and objects (in C++) have a drop-down that allows you to check the underlying values.
- Watch: the debugger allows you to track any value throughout the execution of the program. You can add watched expressions using the + button.
- Call stack: the stack trace that led to where you are. You can click on each frame (i.e. each element of the list) to check the status of that function and its locals.
- Breakpoints: list of the currently set breakpoints.
Debugging Criterion
Because of how Criterion works, debugging it is a little bit different from debugging regular programs.
Criterion’s documentation indicates that, in order to debug tests, you need to first launch your testsuite with a special flag --debug, then attach a GDB client to the server that is spawned by the testsuite. What we need to do on the VS Code side of things is to attach GDB. In order to do this, use the following configuration. Note that only the configuration is included here. This configuration should be added to your existing debug configs.
{
    "name": "Debug Criterion",
    "type": "cppdbg",
    "request": "launch",
    "cwd": "${workspaceFolder}",
    "miDebuggerServerAddress": "localhost:1234",
    "program": "${workspaceRoot}/testsuite",
    "MIMode": "gdb"
}
You will need to change program to where your testsuite binary is located.
In order to use this config, first run your testsuite. You should also specify which test you want to debug, like so:
$ ./testsuite --filter=MyTestSuiteName/MyTestName --debug --verbose
See here for additional testsuite command line options. Criterion will tell you that it has launched a server on port 1234. Now launch your Criterion debug configuration and you’re good to go!
VS Code + WSL or SSH
VS Code can be ran on other machines (via WSL or through SSH) using the Remote extensions.
- For WSL, simply run
code .in the directory where you want to use VS Code. The Remote WSL extension will be installed automatically. Make sure you have already installed WSL (preferably WSL 2) and VS Code on Windows. You do not need to install VS Code inside WSL: the VS Code server will be downloaded and updated automatically. - For SSL, follow the documentation
Other Remote options are available, notably running VS Code from a Docker container or via GitHub Codespaces.
About the .vscode folder
You may have noticed that almost everything related to VS Code goes in the .vscode folder. The big question is: what should you do with this folder?
My personal opinion is that you should commit the .json files that are in it. This will allow everyone in your group that uses VS Code to use the same configs, debug launch configs and tasks. However, some extensions will also generate .log files in it (namely the Makefile Tools extension), which you should 100% add to your .gitignore file (a simple .vscode/*.log should do the job).
See this StackOverflow post for additional discussions.
An example of a settings.json file could be:
{
    "[http]": {
        "files.eol": "\r\n"
    },
    "files.insertFinalNewLine": true,
    "editor.formatOnSave": true
}
This file:
- Sets the file endings to
\r\nfor all files that fall under the “http” language(in this case, this comes from the REST Client extension mentioned above). - States that all files must end with a single line ending.
- Sets the formatter so that it is ran every time a file is saved.
Non-language-specific configuration (e.g. the two last settings in the example) can be set using the Settings GUI, just make sure you select “Workspace” in the tabs to force those settings to be saved for the workspace.
Extra Extensions
Here is a list of extensions that can be useful at EPITA for ING1 in no particular order.
General
- Code Spell Checker for spel sheking in ur kode
- Markdown All in One for Markdown editing
- Todo Tree, a very handy todo highlighter and visualizer
- Vim, Vim emulation for VS Code
- A proper icon theme (e.g. vscode-icons or the one in Monokai Pro)
C/C++
- autoconf: syntax highlighting for GNU Autotools files
- C/C++ Extension Pack: official extension pack with everything and the kitchen sink for C/C++ development. Very handy for a quick start. Has:
- The official C/C++ extension, additional themes and syntax support.
- CMake syntax highlighting and project support
- Remote WSL, Containers and SSH
- The official GitHub extension that allows you to work on issues and pull requests directly inside VS Code.
- Live Share and its audio call companion
- A documentation stub generator for Doxygen
- Makefile Tools for autoconfiguration of projects that only use Makefiles.
Spider/Tiger/Chess
- Caddyfile syntax if you decide to use Caddy to test your Spider project
- REST Client for syntax highlighting in your request files and a simple REST client for testing your Spider project.
- language-tiger for .tig file autocompletion for Tiger and Tigrou
- PGN syntax support for Chess
Conclusion
VS Code is one of the most powerful editors for C/C++ around and one of the best choice for EPITA. It provides the flexibility and help needed for the medium to large scale projects here, and should at least be considered. It is still not an official editor here, but I hope that this will not stop students from trying it out.
Feel free to hit me up on Discord if you notice anything fishy here!
-
Criterion itself can be manually installed with a well-documented process, but said installation does not “create” a package on the system. Build systems that rely on pkg-config, such as the provided automake configuration for the Spider project, will not see Criterion. Modifying said configuration is heavily discouraged, as breaking something is pretty easy. ↩︎
-
More specifically, it is managed and updated by the CRI (Centre des Ressources Informatiques, IT Resources Center). ↩︎